
The gender pay gap has been a trending headline that often attracts attention with bold statements, such as: "Women make 77 cents to every dollar men make".
Gender (pay) gap articles often focus on either the uncontrolled gender pay gap or the percentage of women on company Executive Boards. This may lead to window dressing (e.g. externally hiring one woman to hit the 30% women on Boards quota), incorrect conclusions (e.g. believing to have sufficient female executives once a Board quota is met) and inappropriate measures (e.g. lack of insights into ratios and succession planning below the Board).
In this article, I provide a contextual background and relevant analysis insights from hkp/// RemuNet’s Global ExecuNet (*) survey.
In this article, I provide a contextual background and relevant analysis insights. I’m able to use data from hkp/// RemuNet’s Global ExecuNet (*) survey. Furthermore, I introduce a holistic approach to assess the gender (pay) gap.
Different approaches, different results
Different approaches yield different results. This certainly holds true for the gender pay gap. The below pictogram outlines a simple statistical – but real world – example of the wide range of outcomes under three different methodologies of analysis:
The (1) “Uncontrolled – Entire Population” method, entails a straight Median-to-Median base salary comparison without any control variable across participating companies. In a networked environment, where participating companies pledge to correlate to an common exchange mechanism, the (2) “Per Netgrade – Entire Population” method can be used. This adds a control variable for job level across all companies. Finally, we propose the – most granular – method (3) “Per Company Grade”, thus, taking into account companies’ pay philosophy (i.e. one company/industry may pay higher than another) and companies’ grading specificities (i.e. narrow-banded vs broad-banded).
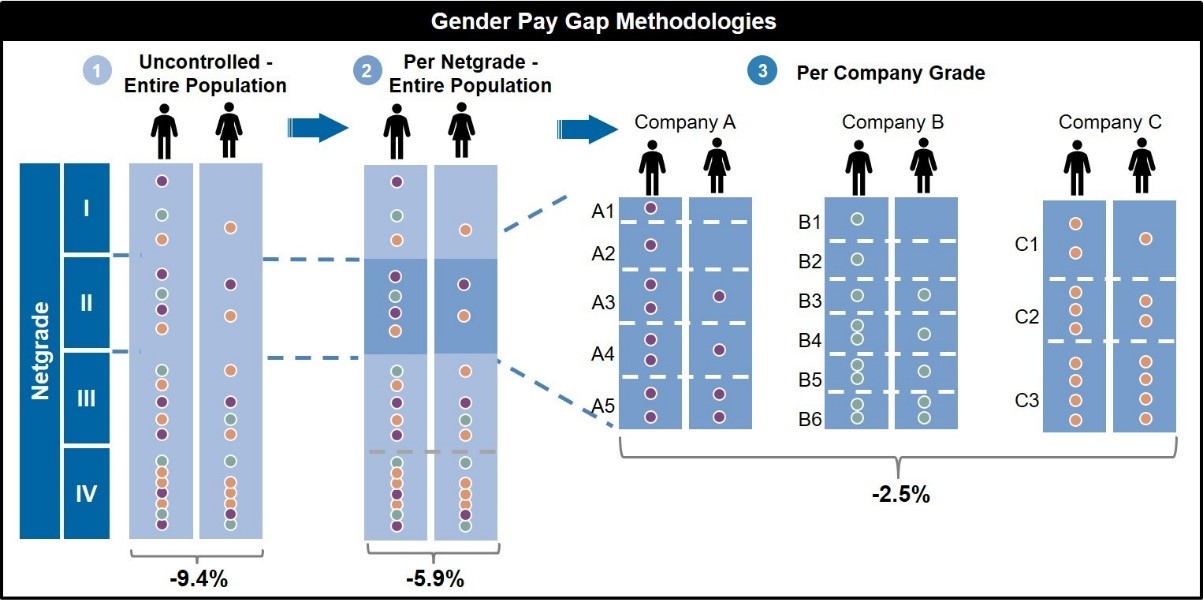
Figure 1: Gender Pay Gap Methodologies
Like-for-like job comparison
The “Uncontrolled – Entire Population” method provides the often reported uncontrolled pay gap. Across all companies globally this is -9.4% in this dataset of management to senior executive staff. If we add a Netgrade control variable to remove skewness of fewer women at the top of organizations, the gap decreases to -5.9%. Finally, also analyzing per company-specific grade, the gender pay gap further decreases to -2.5% in this global dataset.
In my experience, we often found that the pay gap further shrunk with more sophisticated and extensive analysis in which additional elements (such as years in position and past performance) were added. Thus, a like-for-like job often yielded no significant pay difference based on gender.
Consistent with global findings, the three methodologies yield similar results in various countries and regions across the globe. In the United States, a pay gap of -7.4% decreases to -1.7% and in the Eurozone from -10% to -3.4%. In China, a positive pay gap (meaning women are paid higher than men) is even observed when using Methodology 3: “Per Company Grade”.
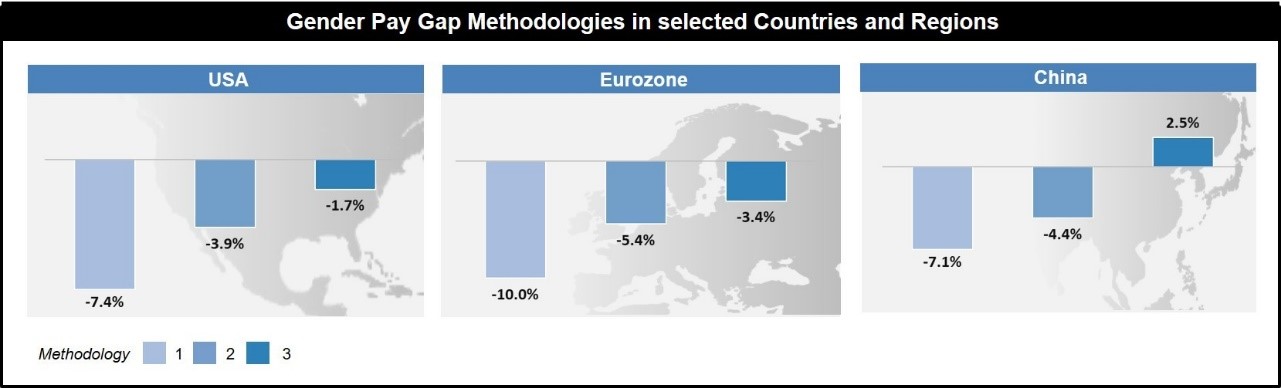
Figure 2: Gender Pay Gap Methodologies in selected Countries and Regions
Significant differences are observed among countries using the “Per Company Grade” method. For example, in The Netherlands the gap is relatively high at -6.3%. China is the only country in this dataset in which women get paid higher than men.
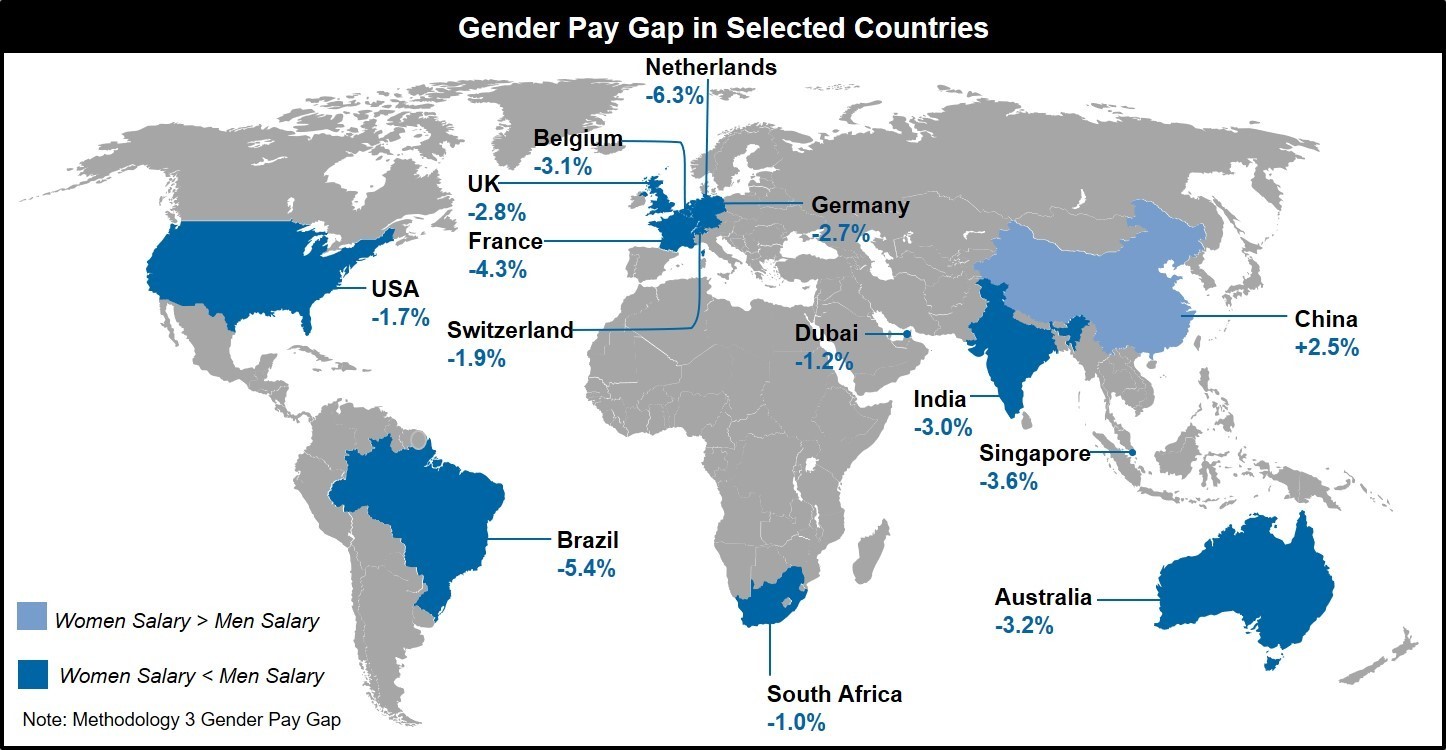
Figure 3: Gender Pay Gap in selected Countries
The gender opportunity gap
Why is the uncontrolled (Method 1) higher than the controlled gender pay gap? It’s because women are less likely to reach higher positions – and thus higher-paying jobs – compared to men. This is called the gender opportunity gap and can be further researched by analyzing the gender ratio per level.
Women are often underrepresented in management boards but how is this at levels below the board? Around the globe, we observe women to be significantly underrepresented at these levels. At Netgrade IV – typically a second managerial role with about 10 years of experience – there are less than 30% women in Europe and APAC (excl. China). Progressing on the career ladder, this decreases further to about 1 in 10 at Netgrade I, which represents regional CEO roles. China is shockingly outperforming other countries and regions with about double the percentage of women at the highest Netgrade.
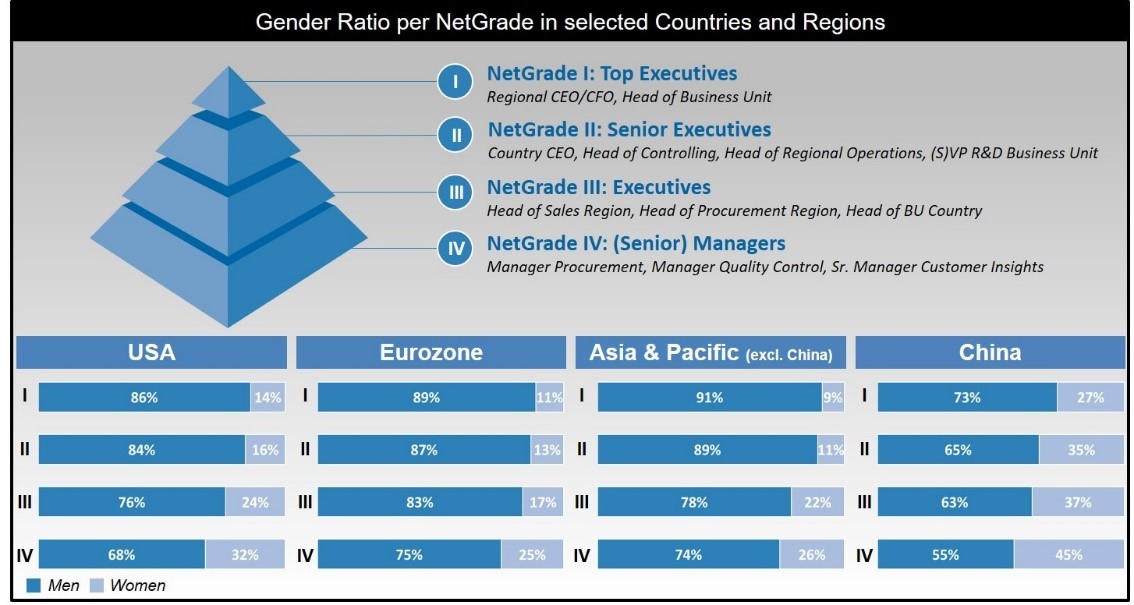
Figure 4: Gender Ratio per NetGrade in selected Countries and Regions
The pipeline for future Board positions lacks women
These are worrisome statistics as they indicate that the pipeline for future Board positions significantly lacks women. It's important that companies start addressing this issue and research how they can ensure more women are able to make it to the managerial levels. This is essential to fill the pipeline and create a sufficiently large recruiting pool to hire future female Executive staff, and eventually Board members. Therefore, I advise to further research these ratios - preferably in a comparative manner versus peers - and promotion rates (percentage women in applicant pool, percentage assessed and percentage selected).
Among European countries, we observe significant differences between the number of women at these levels. However, in none of the countries it is above the 30% threshold. The lowest number of female managers (Netgrade IV) are observed in The Netherlands (1 in 5) and of top executives (Netgrade I) in France. In Switzerland, there are about 2 in 5 female managers (Netgrade IV) but only 1 in 10 senior executives.
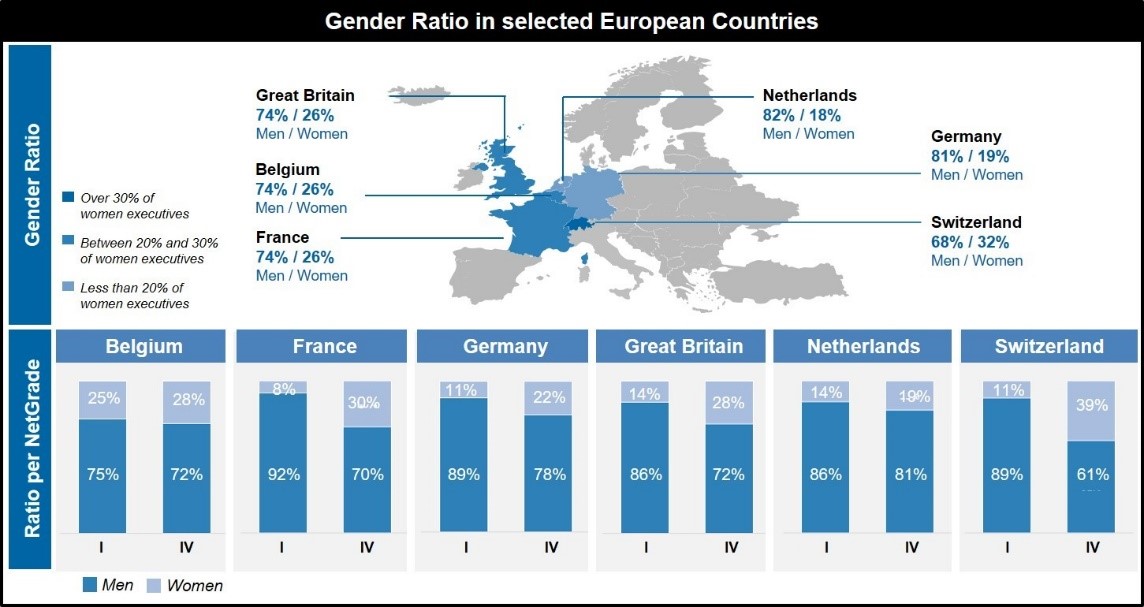
Figure 5: Gender Ratio in selected European Countries
A holistic approach needs to be taken
Determining the gender pay gap and gender ratios are good first steps in the process of determining the gender gap. However, I advise a holistic approach in which also recruitment data (e.g. what positions do women apply for), promotion rates, other aspects of pay (e.g. starting salaries, salary increases, target achievement of variable pay) and performance scores are thoroughly assessed.
The below graph displays the salary increases per country in Europe. We observe that in many countries women receive a higher salary increase than men. The reason is important to investigate as it could – among others – be due to performance, lower position in range, or simply higher increases irrespective of performance differences.
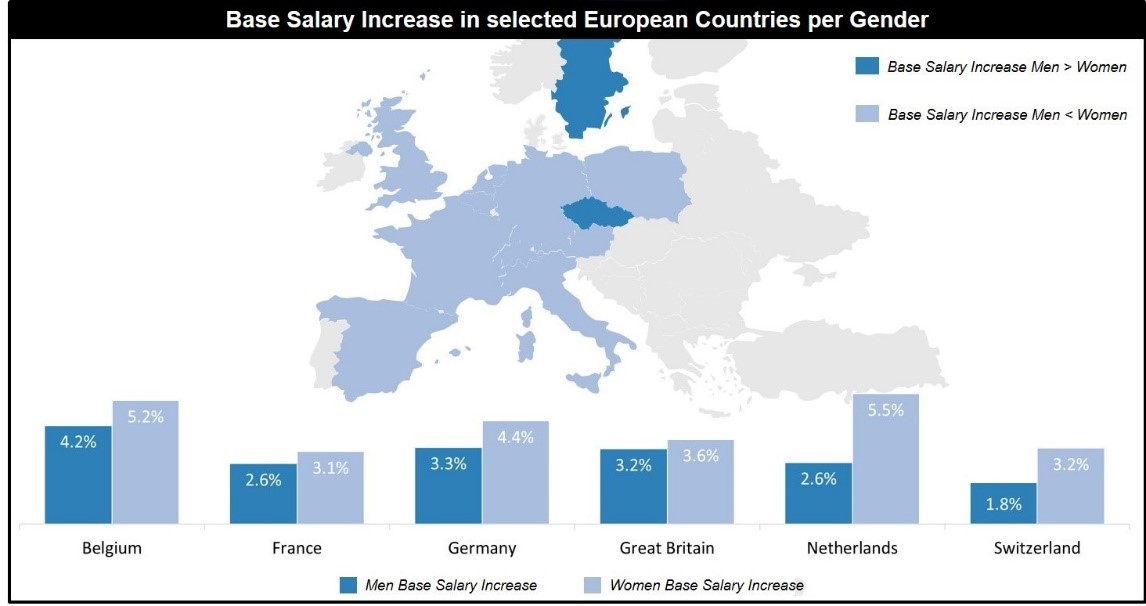
Figure 6: Base Salary Increase in selected European Countries per Gender
Follow-up research would focus on performance differences. Research from our Global ExecuNet survey highlights interesting differences, as shown below. This could – partially – explain the differences in salary increases.
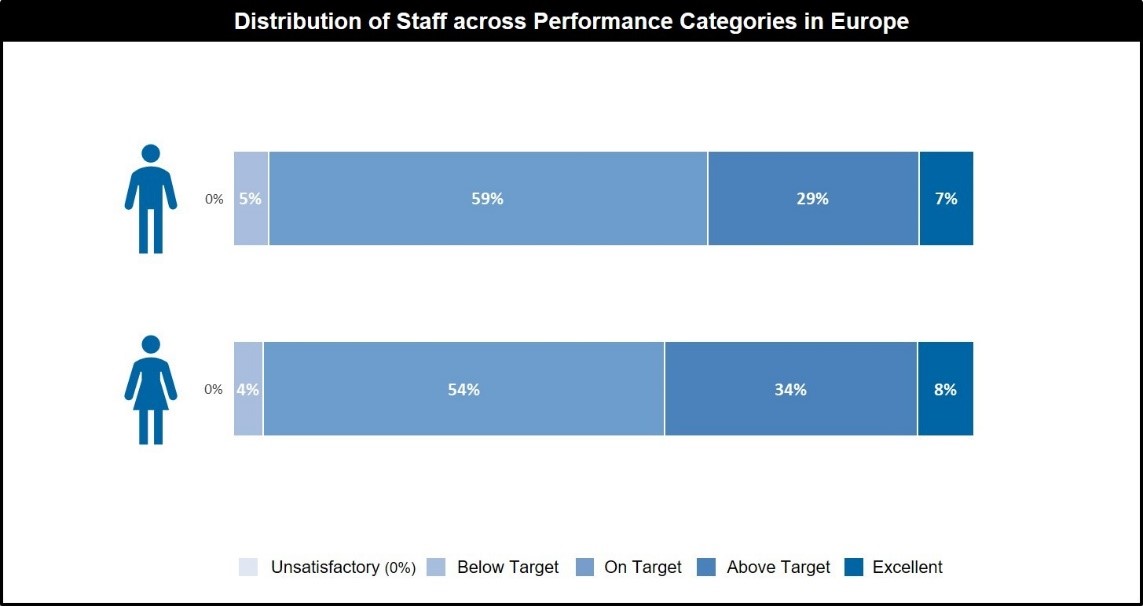
Figure 7: Distribution of Staff across Performance Categories in Europe
Ask the right targeted questions
When approaching the gender gap, it is important to ask the right targeted questions. A holistic approach is essential to identify the real underlying issues and address these with appropriate measures.
In my experience, it is especially valuable to look at data in a comparative context. I'll never forget a discussion with a CHRO I had several years ago. He asked us to look into a specific population (women in tele sales) in the organization that underperformed (low performance, high absenteeism). This was indeed true when compared to other populations at this company. However, when we compared it with the same type of population at peer companies, we actually found that the group was doing significantly better than similar staff groups at peer companies.
(*) The data researched stems from hkp/// group Global ExecuNet survey. The scope of surveyed staff is management-to-senior-executive levels. As a consequence, there is a natural skew in the data. As per survey methodology, all data is in FTE (the number of part-timers in this dataset is limited anyhow).
Barry Kitz is a Managing Consultant at hkp/// RemuNet and leads the analytics practice. He is passionate about data analytics and visualization.